[데이터 시각화] Quick Chart를 활용하여 차트 만들기📊
간단하게 차트를 생성할 수 있는 Open API인 quickchart.io에 대한 차트 생성 실습
- Gallery에서 예시 차트들을 확인할 수 있습니다.
QuickChart Editor
QuickChart Editor를 사용하여 차트를 직접 생성할 수 있습니다.
Quickchart Python
quickchart-python를 사용하여 파이썬에서 실행할 수 있습니다.
quickchart.io 설치 방법
1
pip install quickchart.io
예시 코드
1
2
3
4
5
6
7
8
9
10
11
12
13
14
15
16
17
18
19
20
21
22
23
24
25
26
from quickchart import QuickChart

qc = QuickChart()
qc.width = 500
qc.height = 300

# Config can be set as a string or as a nested dict
qc.config = """{
  type: 'bar',
  data: {
    labels: ['Q1', 'Q2', 'Q3', 'Q4'],
    datasets: [{
      label: 'Users',
      data: [50, 60, 70, 180]
    }]
  }
}"""

# You can get the chart URL...
print(qc.get_url())

# Get the image as a variable...
image = qc.get_image()

# Or write the chart to a file
qc.to_file('mychart.png')
결과
- Bar 그래프
실습 : 한국 코로나19 감염 추이
Python 스크립트에서 Quick Chart 모듈을 사용하지 않고 json 파라미터 형식으로 전달했습니다.
코드
1
2
3
4
5
6
7
8
9
10
11
12
13
14
15
16
17
18
19
20
21
22
23
24
25
26
27
28
29
30
31
32
33
34
35
36
chart = {
    "type": "bar",
    "data": {
        "labels": self.chart_labels,
        "datasets": [
            {
                "type": "line",
                "label": text.get('plot_data_one'),
                "borderColor": "rgb(255, 99, 132)",
                "backgroundColor": "rgba(255, 99, 132, 0.5)",
                "fill": "false",
                "data": self.chart_data
            }
        ]
    },
    "options": {
        "title": {
            "display": "true",
            "text": text.get('plot_title'),
        },
        "scales": {
            "xAxes": [
                { "scaleLabel": { "display": "true", "labelString": text.get('plot_xlabel') } }
            ],
            "yAxes": [
                {
                    "ticks": { "beginAtZero": "true" },
                    "scaleLabel": { "display": "true", "labelString": text.get('plot_ylabel') },
                }
            ]
        }
    }
}

chartUrl = 'https://quickchart.io/chart?bkg=%23ffffff&c='
chartUrl += parse.urlencode({'data': json.dumps(chart)})
결과
- Line 그래프
실습 : 이중 파이/도넛 그래프
코드
1
2
3
4
5
6
7
8
9
10
11
12
13
14
15
16
17
18
19
20
21
22
23
24
25
26
27
28
29
30
31
32
33
34
35
36
37
38
39
40
41
42
43
44
45
46
47
48
49
50
51
52
53
54
55
56
57
58
59
60
61
62
63
64
65
66
67
68
69
70
71
72
73
74
75
76
77
78
79
80
81
82
83
84
85
86
87
88
{
  type: 'doughnut',
  data: {
    datasets: [
      {
        data: [27, 26, 85, 2],
        backgroundColor: [
          'rgb(255, 99, 132)',
          'rgb(255, 159, 64)',
          'rgb(255, 205, 86)',
          'rgb(75, 192, 192)',
          'rgb(54, 162, 235)',
        ],
      },
      {
        data: [27, 0, 26, 0, 67, 18, 0, 2],
        backgroundColor: [
          'rgb(255, 99, 132)',
          'rgb(255, 255, 255)',
          'rgb(255, 159, 64)',
          'rgb(255, 255, 255)',
          'rgb(255, 205, 86)',
          'rgb(255, 255, 255)',
          'rgb(75, 192, 192)',
          'rgb(255, 255, 255)',
          'rgb(54, 162, 235)',
          'rgb(255, 255, 255)',
        ],
      },
    ],
    labels: ['Chocolate', 'Mont Blanc', 'Cheese Cake', 'Macaron'],
  },
  options: {
    title: {
      display: true,
      text: 'Donut Chart(2022.12.30)',
    },
    plugins: {
      datalabels: {
        display: true,
        formatter: (data, ctx) => {
          if (ctx.datasetIndex == 1 && (ctx.dataIndex % 2 == 1 || ctx.dataIndex == 6)) {
            return null;
          } else {
            return data + '명';
          }
        },
        color: '#444',
        font: {
          size: 12,
        },
      },
      doughnutlabel: {
        labels: [
          {
            text: '전체 합계',
            font: {
              size: 12,
            }
          },
          {
            text: '140명',
            font: {
              size: 15,
              weight: 'bold'
            }
          },
          {
            text: '',
          },
          {
            text: '안쪽 파이 합계',
            font: {
              size: 12,
            }
          },
          {
            text: '120명',
            font: {
              size: 15,
              weight: 'bold'
            }
          },
        ]
      }
    }
  }
}
코드 경량화(Minify)
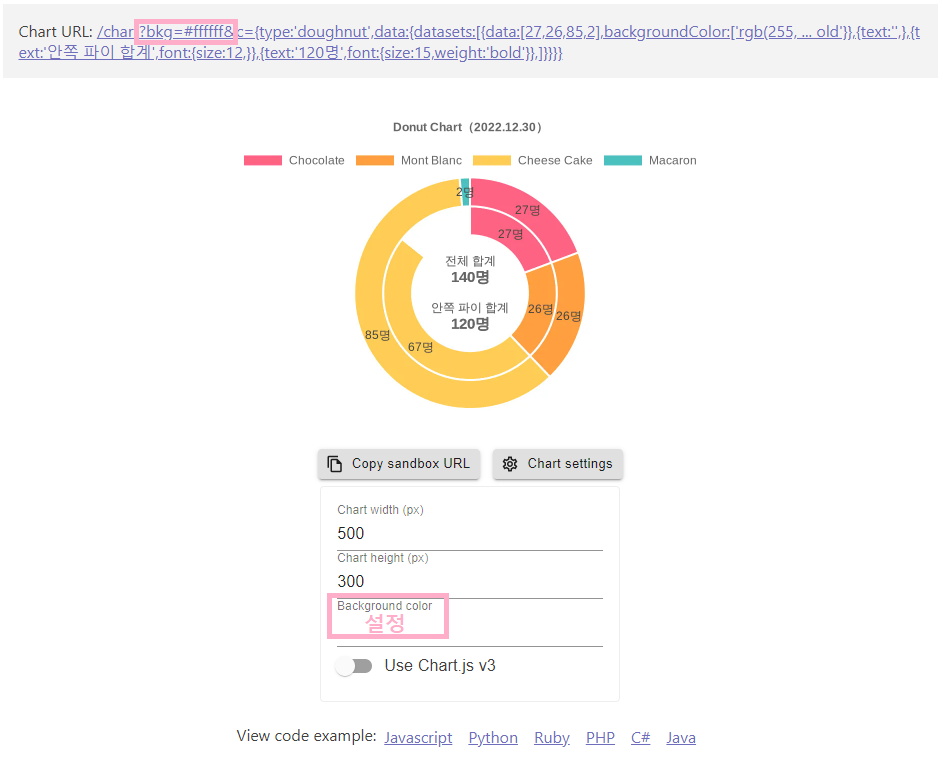
차트 배경 색 설정

결과
- Double doughnut 그래프

댓글남기기